Why the Economy Should Be Read as a Flow, Not Just as Numbers
Viewing an economic indicator as a single number can easily create a misleading impression. Learn how to read the economy’s underlying flow by examining the direction and speed of quarter-over-quarter and month-over-month changes, the limits of annualized rates, seasonal adjustment, and the possibility of data revisions.
- By
- Sungnavi
- Published
- Updated
- 6 min read
- 6 min read
- Economics Basics
- Seasonal Adjustment
- Economic Indicators
- Annualized Rates
- Economic Growth Rates
In this article
When looking at the many economic indicators released every day, it is easy to misjudge the economy’s true temperature if you focus only on the numbers themselves. When news reports present growth or price indicators, failing to identify the direction in which a number is moving relative to the past can leave you trapped in a single moment, as if you were viewing a still image rather than a video. The economy is not a snapshot at one point in time. It must be read as the continuous trajectory—or flow—that indicators form over time to understand its reality fully.
Check the direction and acceleration through consecutive rates of change first
The U.S. Bureau of Economic Analysis (BEA) recommends using quarter-over-quarter or month-over-month rates of change to assess short-term movements in production, spending, and prices. The key is not the number at a single point in time, but comparing rates of change across consecutive periods to identify the “flow.”
For example, even if an indicator maintains quarter-over-quarter growth of 3%, the economic interpretation will be entirely different depending on whether its growth rates have been rising from 1% to 2% to 3%, or slowing from 5% to 4% to 3%. Even with the same positive (+) number, an increase in speed indicates expansion, while a decrease in speed signals a slowdown. Detecting a turning point at which the sign changes and the figure becomes negative is also possible only by examining a continuous time series.
Beware the illusion of an “annualized rate” inflated to a full year
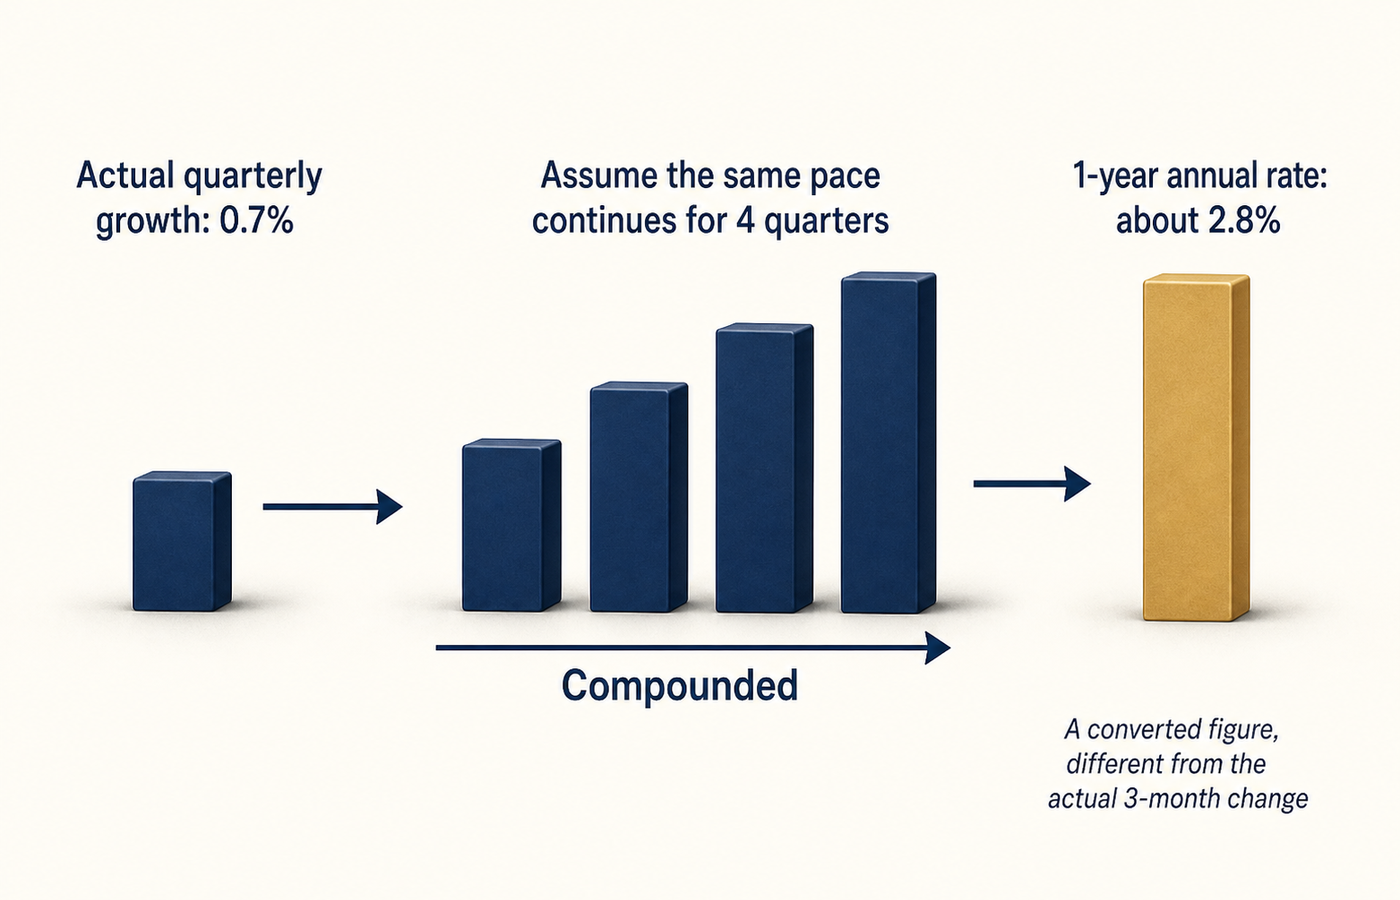
News about U.S. gross domestic product (GDP) growth often includes phrases such as “growth at an annualized quarter-over-quarter rate of 2.8%.” An “annualized rate” assumes that the growth pace recorded during the current quarter (3 months) continues unchanged for all 4 quarters of 1 year, and converts it on a compounded basis. Despite the potential for misunderstanding, statistical agencies use annualized rates for a clear reason: they place short-term results covering different periods on the same 1-year scale, making them easier to compare intuitively with annual economic growth targets or annual interest rates.
The problem is that this converted number can diverge from what people experience in daily life. For example, even if the actual growth rate for a quarter is only 0.7%, converting it into a 1-year annualized rate produces a much larger figure of about 2.8%. The magnitude of the movement that actually occurred during 1 quarter remains unchanged, but the number extended to 1 year moves into a different range because of compounding. This makes it easy to see a large figure in a news headline or YouTube thumbnail and mistakenly conclude, “The economy grew by as much as 2.8% over the past 3 months.”
The U.S. Bureau of Economic Analysis (BEA) also warns that presenting volatile components at annualized rates can cause unnecessary market misunderstandings. In particular, annualizing a monthly rate of change amplifies a short-term shock to the 12th power, making the statistic appear abnormally exaggerated. If reporting with a particular agenda exploits this effect by using a sensational headline such as “15% surge at a month-over-month annualized rate,” readers may become unnecessarily anxious or excessively optimistic. To avoid being swayed by enormous annualized figures in headlines, it is essential to check the original rate of change for the actual quarter or 1 month.
Track the flow of seasonally adjusted indicators after removing recurring fluctuations
“Seasonal adjustment” is the process of removing factors that recur in particular months or quarters each year, such as holiday spending, winter heating demand, and summer vacation activity. Only after this adjustment does the underlying trajectory of the business cycle hidden behind routine seasonal effects become clearer.
For example, department store and supermarket sales rise sharply during the year-end shopping season every December. Without seasonal adjustment, simply comparing the figure for December with November could make it appear that the economy has suddenly surged, when it is actually only the recurring year-end boost seen every year.
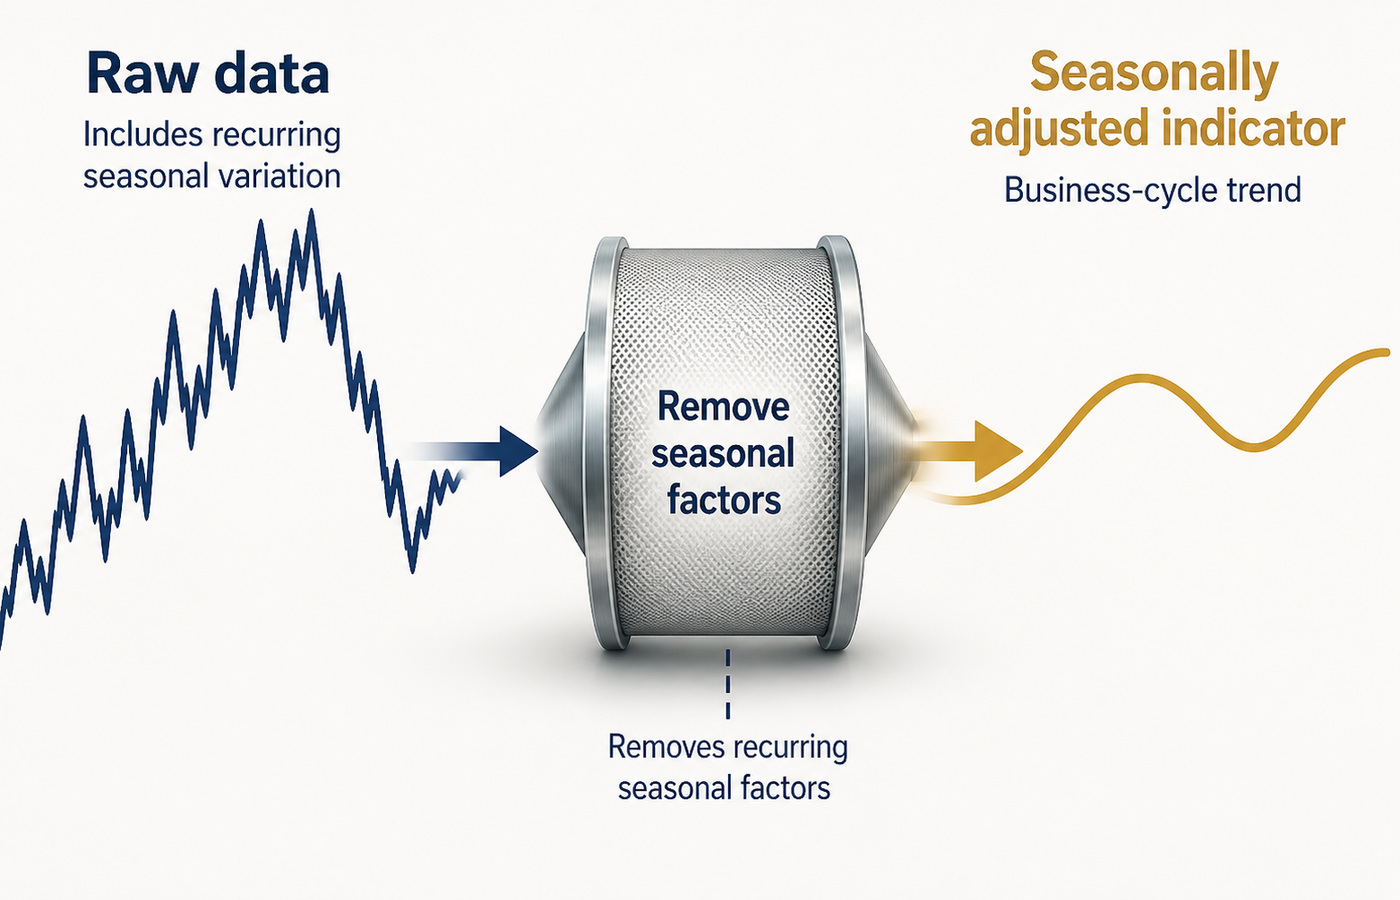
Seasonally adjusted indicators can also produce results that seem counterintuitive. Even if production in a particular month falls from the previous month, the seasonally adjusted result may show that production increased relative to the previous period if the decline was smaller than the decrease normally experienced in that month each year. This is why the economy should not be judged hastily from a simple rise or fall in a number.
In my case, I tend to review my apartment maintenance bill carefully every month. The electricity charge for July this year was markedly higher than in June, so even though August was sweltering, I decided that I would have to cut back substantially on air-conditioner use. However, when I compared the increase in electricity charges from June to July last year, I found that the rate of increase in July this year was actually much lower. I was seeing the effect of replacing the old living-room air conditioner with a Grade 1 model this spring. This was seasonal adjustment in everyday life. If I had focused only on the increase in July electricity charge without making a seasonal comparison, I might not have fully benefited from replacing the air conditioner with a Grade 1 model.
Treat initially released figures as preliminary
Economic indicators are not fixed, immutable numbers that become complete the moment they are released. The U.S. Federal Reserve’s (Fed) industrial production index is revised continuously as new underlying data are incorporated each month over the 6 months following the initial release. Later, regular annual revisions may readjust the entire historical time series.
Care is also required when verifying the growth rate reported at a particular point in the past. Because each release uses a different data vintage, casually mixing revised data from different points in time can produce a figure entirely different from the rate reported at the time. The more recent an indicator is, the more important it is to allow for the possibility that it remains preliminary and may be revised, and to observe the pattern across successive releases patiently.
Interpret numbers in context, not in isolation
When reading economic news, it is easy to let a single isolated number trigger a temporary emotional or impulsive reaction and lead to a hasty decision about managing valuable assets. To avoid being misled by headlines, always keep four factors in mind: consecutive rates of change, the annualized rate and its underlying period, whether seasonal adjustment has been applied, and the possibility of future revisions. News reports and economic commentary videos often address these points well, but many also use provocative figures to attract attention. As the habit of comparing the direction and speed indicated by multiple indicators takes hold, the context of the real economy moving behind the surface numbers will gradually become clearer. ▣
Related articles

How PCE and Core PCE Differ: How the Fed Reads Inflation
We examine the measurement scope and calculation methodology of PCE and core PCE, as well as their differences from the consumer price index (CPI). We also explain why the U.S. Federal Reserve targets 2% headline PCE while using core PCE to track underlying inflation trends.
- PCE
- Core PCE
- Federal Reserve
- consumer price index (CPI)
- monetary policy

CPI vs. PPI: The Simplest Way to Read Inflation News
CPI reflects the prices consumers actually experience, while PPI tracks prices at the production stage for businesses. Understanding the difference makes inflation news and interest-rate outlooks much easier to read.
- CPI
- Price Indicators
- Interest Rates
- Inflation
- PPI