
How PCE and Core PCE Differ: How the Fed Reads Inflation
We examine the measurement scope and calculation methodology of PCE and core PCE, as well as their differences from the consumer price index (CPI). We also explain why the U.S. Federal Reserve targets 2% headline PCE while using core PCE to track underlying inflation trends.
- By
- Sungnavi
- Published
- Updated
- 5 min read
- 5 min read
- PCE
- Core PCE
- Federal Reserve
- consumer price index (CPI)
- monetary policy
In this article
When the U.S. Federal Reserve (the Fed) decides interest rates, one of the key indicators it monitors each month is the Personal Consumption Expenditures (PCE) price index. Alongside this, the term core PCE also appears frequently. While they may look like similar inflation statistics on the surface, the two metrics provide a more multidimensional perspective by viewing the economy through different analytical lenses.
PCE Covers Not Only Direct Spending but Also Costs Paid on Consumers’ Behalf
The Personal Consumption Expenditures (PCE) price index is compiled by the U.S. Bureau of Economic Analysis (BEA). It measures price changes not only for goods and services purchased directly by U.S. residents, but also for expenses paid on behalf of consumers by other entities—such as government programs or insurance companies.
While we examined households’ direct out-of-pocket spending through the consumer price index (CPI) in the previous article, total household consumption also includes spending made on behalf of households by the government or institutions. Examples include expenditures by nonprofit institutions serving households, as well as medical expenses covered by the government or employers, such as Medicaid. The PCE price index is designed to capture broader direct and indirect consumption as a whole, going beyond just the receipts individuals swipe their cards for at the grocery store checkout.
‘Core PCE’: Revealing the Core Trend by Excluding Volatile Items
The core Personal Consumption Expenditures (core PCE) price index is an indicator that excludes volatile food and energy categories from the overall PCE index. The goal is to clearly reveal the core, persistent inflationary pressure over the medium to long term by filtering out noise that fluctuates sharply in the short term due to extreme weather events (such as hurricanes, cold snaps, or heat waves) or geopolitical shocks (such as regional conflicts or wars).
The items excluded when calculating core PCE are clearly defined. Food and beverages purchased for off-premises consumption at grocery stores, gasoline, and electricity and gas utility bills are excluded. In contrast, dining-out food services and accommodations, which exhibit relatively lower price volatility, remain in the core index.
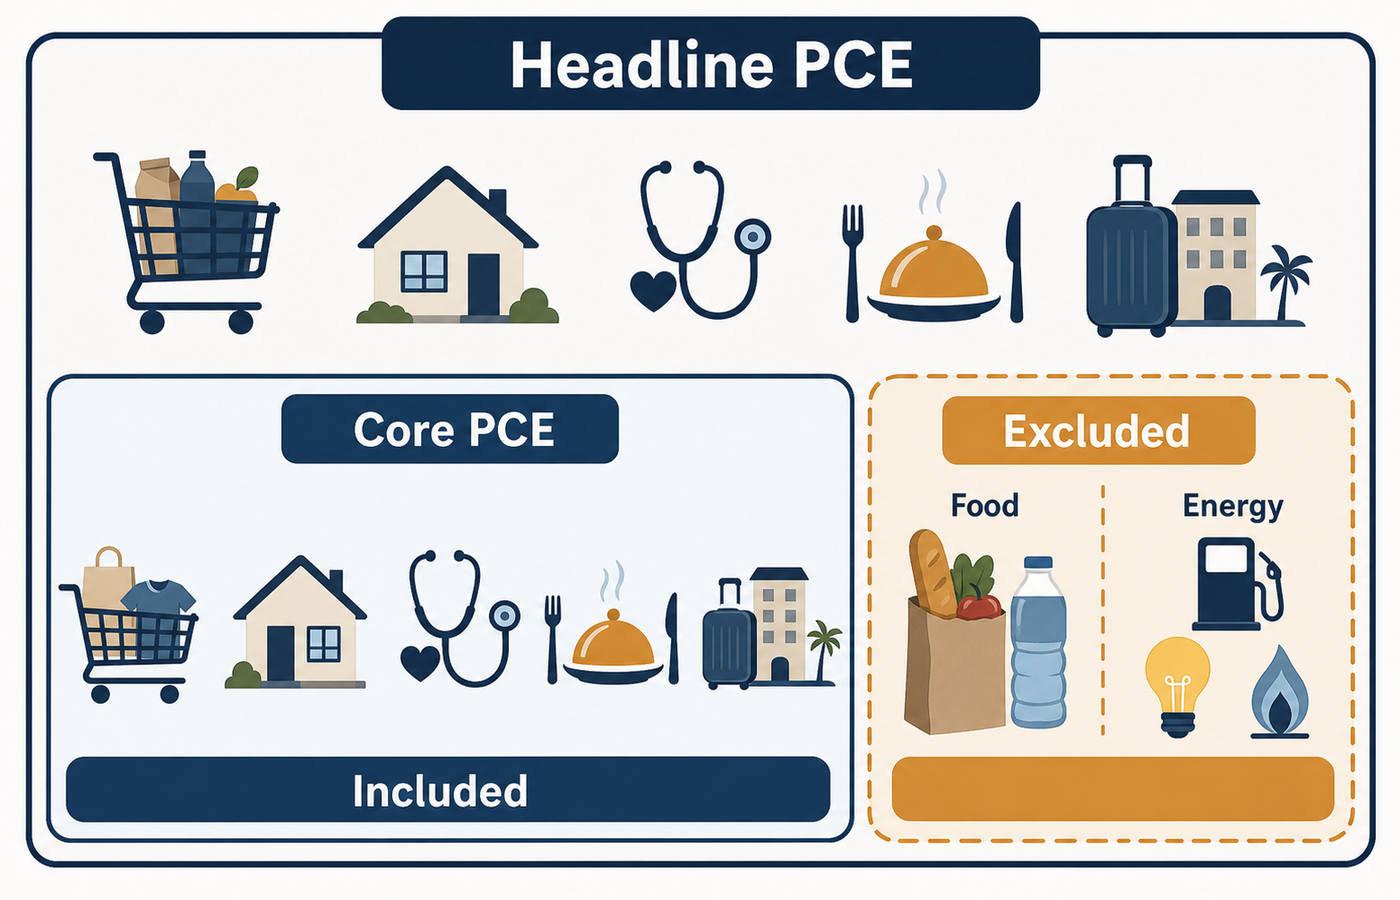
For everyday consumers, excluding food, gasoline, and electricity bills—items considered so essential—might seem somewhat puzzling, but this does not mean that the cost of daily living is being dismissed. The Fed also acknowledges the importance of these items. However, when seeking a benchmark for monetary policy decisions, the reason for tracking the core PCE price index is that identifying the ‘underlying’ trend centered on slower-moving, more consistent items while excluding highly volatile components provides a clearer picture of the underlying degree of inflation.
CPI and PCE Differ in Coverage and Calculation Methodology
Although the consumer price index (CPI) and PCE share the common purpose of measuring consumer-level inflation, they are structurally distinct beneath the surface. CPI is primarily based on direct out-of-pocket expenditures paid by urban households. In contrast, PCE also encompasses medical service expenditures and other costs paid on behalf of consumers by the government or institutions.
The formulas used to calculate each index also differ. CPI utilizes a “modified Laspeyres” formula that applies fixed weights based on periodic consumer expenditure surveys. PCE applies the “Fisher-Ideal” formula (a chained-weight method that reflects shifts in consumption quantities) based on National Income and Product Accounts (NIPA) data.
When the price of a specific good surges, consumers naturally seek substitutes. The PCE calculation method is designed to promptly reflect these shifts in actual consumption patterns on a quarterly basis. This is why the two indices can show diverging figures when prices for items with different weighting shares, such as housing or healthcare, move in different directions.
Why the Fed’s Official Target Is 2% PCE Inflation
The long-term price stability goal set by the Federal Open Market Committee (FOMC) is an ‘annual headline PCE inflation rate of 2%.’ The reason for targeting ‘2% PCE’ rather than core PCE is that the ultimate objective to stabilize is the headline price level that households actually experience in their everyday lives.
The main reason the Fed uses PCE rather than CPI as its official benchmark also lies in its comprehensiveness. Compared to CPI, the PCE index covers a much broader scope of consumption expenditures and responds sensitively and promptly to shifts in consumer substitution behavior.
Naturally, neither the Fed nor the government relies on a single metric when formulating policy. Rather than rushing to judgment based on a single monthly figure, policymakers evaluate average trends over periods ranging from several months to more than 1 year. They verify the persistence of price pressures by cross-referencing trends across various detailed subcomponents, diverse core measures, and other inflation indicators such as CPI and PPI.
Key Factors to Examine When the Two Indicators Diverge
In some months, headline PCE may surge while core PCE remains subdued, or conversely, the headline figure may decline while the core metric stays elevated. When a divergence between the two indicators widens, the first step is to examine how food and energy prices contributed to the gap.
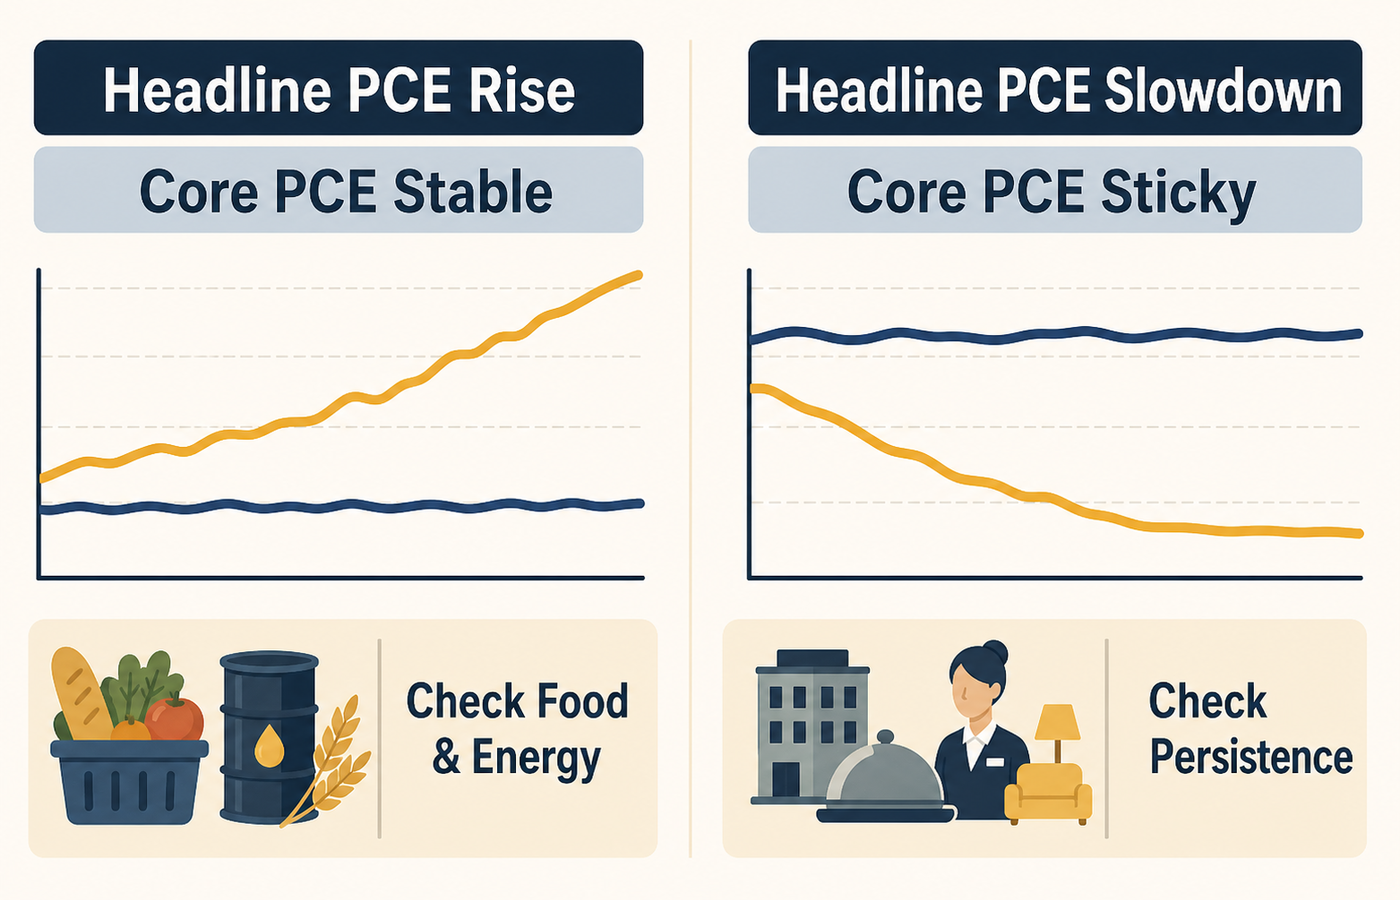
If international oil prices or agricultural prices spike temporarily, pushing up headline PCE while core PCE remains largely unchanged, the situation can be interpreted as likely limited to a short-term shock. On the other hand, if headline PCE fluctuates mildly while the rise in core PCE excluding food and energy remains unabated for several months, it indicates that inflationary pressures have become deeply rooted across the broader economy.
In the past, when hearing news of a sharp spike in PCE driven by surging oil prices, this author once prematurely took a position expecting interest rate hikes, only to realize it was a misjudgment after observing the steady, subdued trend in core PCE. That experience served as a lesson that positions should be determined carefully by considering both indices simultaneously.
When reading inflation indicators, rather than reacting excessively to any single published figure, one needs the perspective and discipline to calmly examine where the divergence between the two indicators originates and whether the trend aligns consistently with other economic indicators.
Sources
- U.S. Bureau of Economic Analysis (BEA), Personal Consumption Expenditures Price Index, What is the Core PCE price index?, What accounts for the differences in the PCE price index and the Consumer Price Index?
- U.S. Federal Reserve, What is inflation, and how does the Federal Reserve evaluate changes in the rate of inflation?, Recent Inflation and the Dual Mandate
Related articles
Why the Economy Should Be Read as a Flow, Not Just as Numbers
Viewing an economic indicator as a single number can easily create a misleading impression. Learn how to read the economy’s underlying flow by examining the direction and speed of quarter-over-quarter and month-over-month changes, the limits of annualized rates, seasonal adjustment, and the possibility of data revisions.
- Economics Basics
- Seasonal Adjustment
- Economic Indicators
- Annualized Rates
- Economic Growth Rates

CPI vs. PPI: The Simplest Way to Read Inflation News
CPI reflects the prices consumers actually experience, while PPI tracks prices at the production stage for businesses. Understanding the difference makes inflation news and interest-rate outlooks much easier to read.
- CPI
- Price Indicators
- Interest Rates
- Inflation
- PPI